Added value of run-time insights
In a distributed IT landscape, gaining insight into the workings of your IT components (such as SOA services, APIs, microservices, cloud solutions, …) is vital because it provides valuable information that lets you:
Determine the health of the component: Based on the gathered statistics, it is possible to determine how well a component is performing. An increase in response times or returned errors might indicate the component is not performing as desired.
Detect misuse of a component: In many distributed environments usage contracts are created that determine how a particular component is to be used by the client(consumer) e.g.: Which operations are to be called, how many calls to the operations are allowed in a given time interval etc… Run-time information will not only allow to verify if the different clients adhere to the terms specified in the contracts, but it will also reveal if the component is only used by its intended clients.
Improve the component: By analyzing usage information insights can be gained on how the component is used. Based on this information enhancements can be made to better service the clients.
Just as an example, imagine an API that allows to query the product catalogue and that is used by customers through a web application. Assume for a moment that the usage information on this API shows that often no results are returned, and that this happens when the customer uses the search term “cellphones”. The product catalogue does contain items for a similar search term (e.g. smartphones), and these results should have been returned. By acting on this information and improving the API it is easy to understand that this might significantly improve customer experience and potentially sales.
In a distributed environment, optimal results can only be achieved if all of the components are working correctly together.

Shortcomings of Integration Platform Monitoring Solutions
For organizations that build their distributed system on a (SOA) service architecture, monitoring would typically be assigned to the Enterprise Service Bus (ESB). Organizations coming from an API centric approach would use their API Gateway. In many cases the fact that these products offer a monitoring solution would be one of the reasons to invest in them. But here also lies the first problem. As organizations realize they will have to combine different architectural styles (use APIs to expose service functionality, use (micro)services to implement API functionality) they are now faced with 2 monitoring solutions and the question on how to integrate them.
Furthermore, as monitoring is only a small part of the functionality offered by these products they have some shortcomings.
First, in many cases the user must use the same general-purpose interface to access the monitoring dashboards and information as any other user of the platform. Given the fact that this is also the interface used by the technical staff to perform their duties (deployment, general management, …) the user experience for these less technical users is far from ideal as there are exposed to complexities that do not relate to their tasks. Also, most of the implementations offer very little support for customization. The solution comes with a set of standard views and reports but it is very difficult to adapt or extend these views.
Second, in order to adequately monitor the assets deployed on these platforms logging must be activated. These logs usually create a huge amount of data that is not very well handled in these out-of-the-box tools. Processing the log information usually slows down the rest of the system, making it unusable for the other users.
Finally, as this logging is limited to the activities happening on the platform (ESB, API Gateway) they only provide information on what is happening on the platform, so no end-to-end view is possible. A feature that is highly desirable in a distributed IT landscape.
The Elastic Stack Solution
The solution to this problem is rather simple, aggregate all the logging information into one single flexible analytics stack that will analyze and visualize all gathered data. Elastic Stack (formerly known as ELK-stack) is an example of such a solution. Architecturally the setup is very simple (see picture) all log information is push to the analytics stack that will handle the monitoring functionality.

To get the log information into Elastic stack, Logstash is used. The sole purpose of Logstash is to facilitate the task of gathering and transforming log data and this in a near real-time fashion. Once the data is processed it is forwarded to Elasticsearch, the search engine component that is built to handle large amounts of data and allows the user to perform analytics on the gathered data. As an interface, the user will use Kibana, the visualization component, which provides the functionality to easily create the different visualizations (dashboards)
By using this platform, we circumvented the afore mentioned shortcomings:
- As all log information is pushed to the Elastic stack by design, Elastic stack is able to create an integrated view and the user is only faced with one interface;
- Since the tooling is aimed at data analysis and visualization it provides a much cleaner user interface and more customization options, and;
- Once the log data is collected in the Elastic stack it can be deleted in the source systems (ESB, API Gateway, Application Servers, …). This will decrease the load on these systems and make them more responsive.
Customer approach
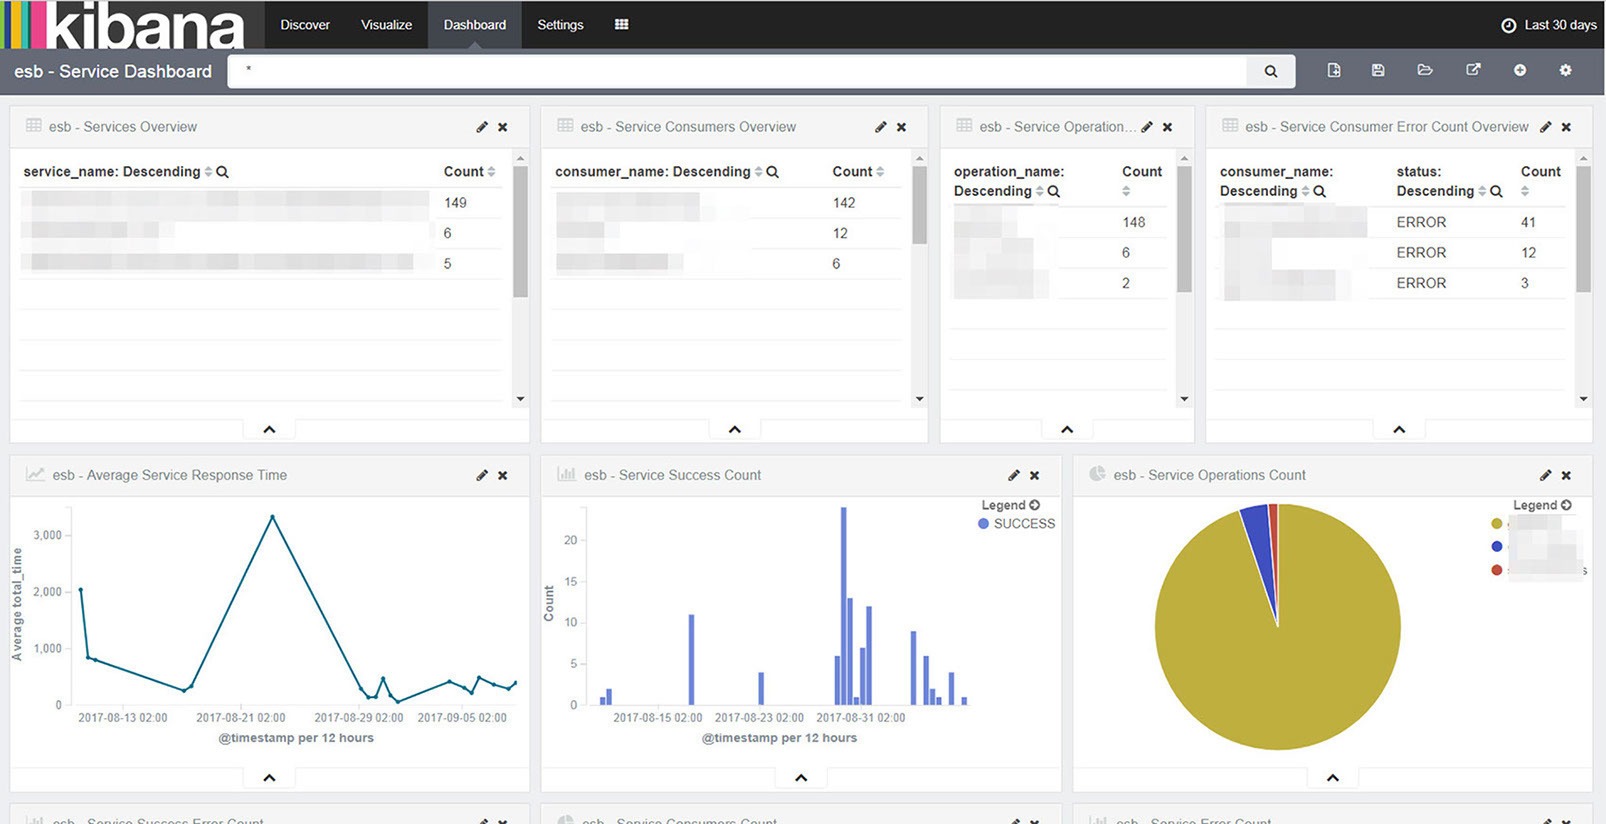
We recently had the opportunity to implement such a solution at a customer. Given the fact the client already had an Elastic-stack operational and we only needed to integrate the log information from their ESB (Webmethods), the implementation was straightforward. We pushed the log information from the Webmethods ESB to the Elastic stack. We then asked for a list of questions they wanted to answer with the monitoring dashboards. Based on these questions we created some general-purpose visualizations (Line chart showing the evolution of the average response time, Pie chart showing who called a particular service…). It is important to note that the platform automatically handles the time aspect of these visualizations. So, with the above examples you are able to see the evolution of the average response time in the last hour as well as the last month (provided you have the necessary data).
Once those basic visualizations were done, we created ‘filter lists’. These were simple tables listing all different services, the different operations and the different clients(consumers). In its own these tables provided little added value but linked together with the visualizations they provided a rich user experience. By selecting an item in these tables, the Elastic platform would automatically only return the data linked to the selection you made. As a consequence, you were now able to, for example, visualize the average response time of operation x on service y for client A for the last day/week/month. All this, by simply selecting the right service, operation, client in the corresponding filter list. Once the dashboards were operational it is important for service providers to start using them. So, we provided training sessions. This training encompassed more than just monitoring. But it gave us the opportunity to show them how the dashboards could help them in their day-to-day work.

Conclusion:
In modern distributed IT environments, where solutions are build using different components (APIs, SOA Services, microservices) it is important to have a comprehensive view on how these different components are performing in production by analyzing run-time information. Monitoring solutions offered by integration platforms such as ESBs and API Gateways are not optimal as their ‘view’ is limited to what is happening on their platform and the user experience is far from adequate. However, by assigning this capability to a comprehensive and integrated analytics solution such as Elastic stack, these shortcomings can be circumvented and a more effective run-time monitoring environment can be delivered.
Some more integration blogs for you
ALWAYS LOOKING FORWARD TO CONNECTING WITH YOU!
We’ll be happy to get to know you.


