Introduction
Monitoring has been an integral part of IT operations for decades, providing insights into system availability and performance. Yet, with the rapid pace of technological advancement, a deep and precise understanding of an organization’s complex technology environment is essential. This understanding helps it stay competitive, foster innovation, and meet business goals. Achieving this level of insight, requires a holistic approach that combines advanced monitoring techniques with a broader perspective. This is where observability comes in. In this blog, we will explore the observability concept, why it is a worthwhile investment for modern businesses, and how to implement it effectively. Let’s start with establishing a clear understanding of the concept of observability and the Observability Maturity Model.
What is Observability
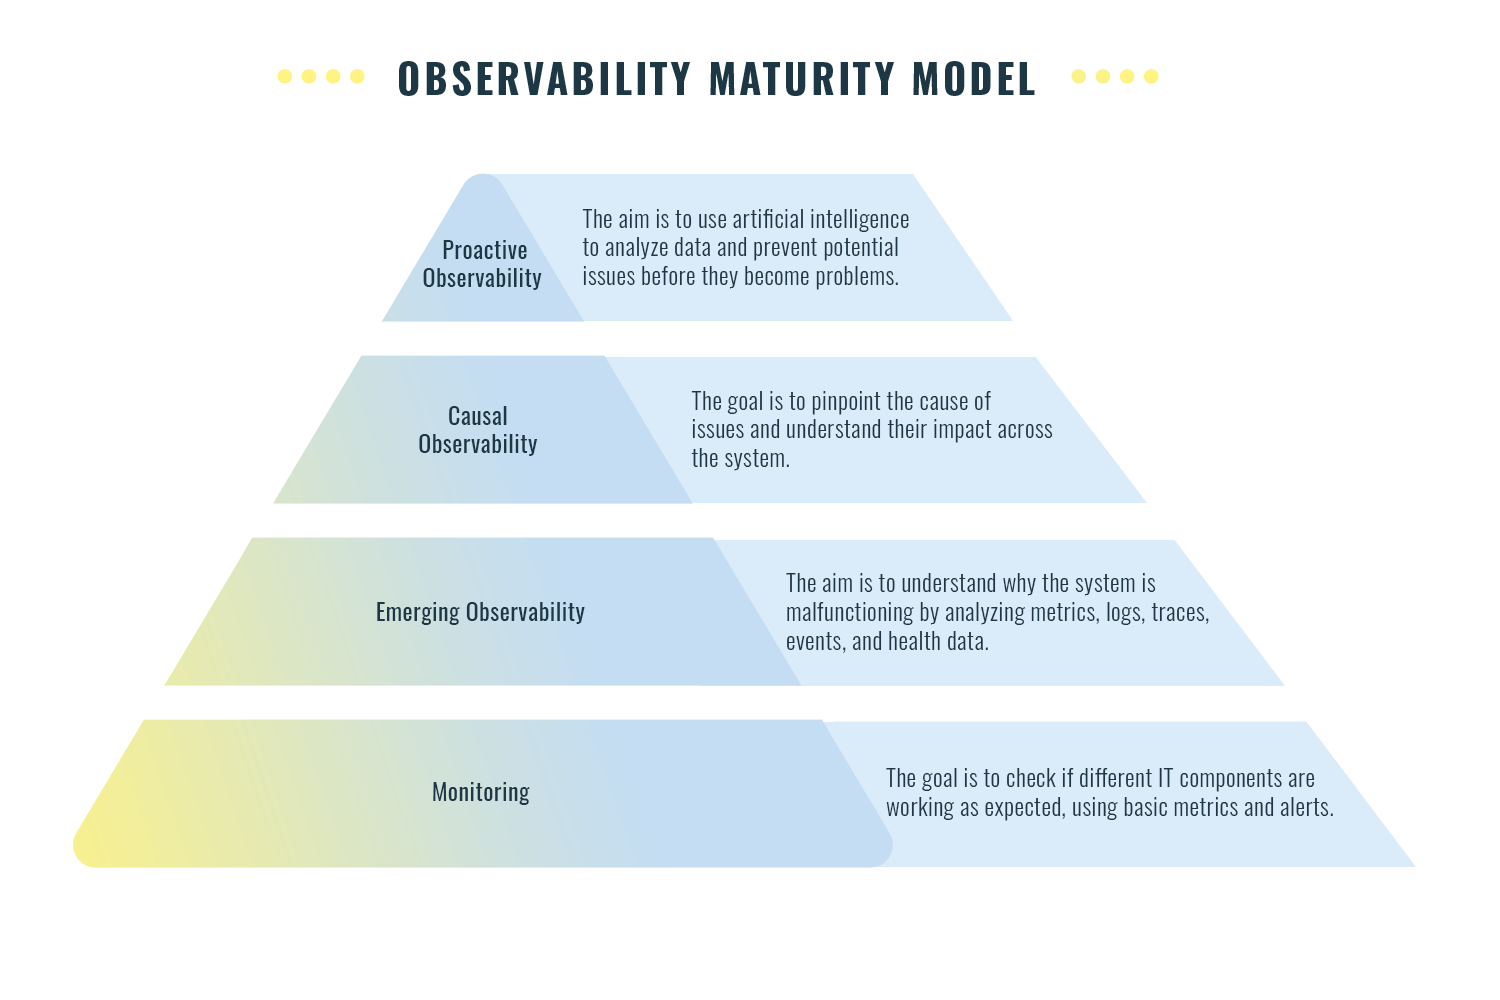
In IT, ‘observability’ refers to the ability to assess a system’s current state using the data it produces, such as logs, metrics, and traces. The Observability Maturity Model outlines four levels of maturity. Each level of observability builds upon the foundation established by the previous levels, adding capabilities for capturing, tracking, and analyzing data. This new functionality enables deeper observability at each successive stage.

At level 1, Monitoring, the goal is to verify that each IT component operates as expected. At this stage, basic information such as health status data of a component is captured through events and component-level metrics. Alerts and notifications serve to inform stakeholders about issues as they occur. This level of observability offers insights into the health of individual components but fails to provide a comprehensive overview. It indicates that a problem exists but does not explain the cause, nor does it pinpoint when or where the issue originated. At this stage, we are aware that something has malfunctioned, yet we don’t know what went wrong.
Example: Imagine you have integrated a new software component into your existing IT infrastructure. Monitoring allows you to observe key metrics such as response times, error rates, and server load. If response times start to spike, the monitoring system will alert you, indicating that there is a potential integration issue. However, it will not provide details about the cause of the delay.
At Level 2, ‘Emerging Observability,‘ the aim is to determine the reasons behind system malfunctions. This involves analyzing three critical types of telemetry data—metrics, logs, and traces—along with event and health state information. On top of alerts and notifications, comprehensive dashboards, featuring various visual tools like graphs and flame charts are used to provide a deeper, broader and more holistic view of overall system health, supporting better problem diagnosis.This level gathers ample system information to deduce what failed and the reasons for failure. However, the lack of automated processes for integrating and correlating siloed data from different sources means that identifying root causes remains a manual and time-intensive process.
Example: Building on the previous scenario, emerging observability goes beyond basic metrics. It might detect that the increased response times are correlated with a surge in incoming API requests from a specific source. This additional information suggests the integration is struggling to handle the sudden influx of data, potentially indicating a scalability issue.
At Level 3, Causal Observability, the goal is to pinpoint the root cause of incidents and to determine their impact across the system. By providing context for events, logs, metrics, and traces across the data silos in an IT environment, a precise map of the topology of business processes, applications, and infrastructure is created. This enables changes to be tracked over time. When something goes wrong, this contextual data, combined with automation, aids in rapidly identifying issues by analyzing how stack component relationships have evolved over time. By correlating telemetry data with system topology and timelines, it shows the cause and impact of changes or failures across the different layers, data silos, teams, and technologies—significantly enhancing resolution speed and business performance.
Example: Going deeper, ‘Causal Observability’ unravels the ‘why’ behind incidents. In this case, it identifies that a spike in API requests results from an unexpectedly popular marketing campaign. Such insights pinpoint the root cause of the increased response times, allowing you to address the scalability issue by adding more resources or optimizing the integration.
At level 4, Proactive Observability, the goal is to analyze large volumes of data, to enable automated, preemptive action, preventing minor anomalies from escalating into major issues. At this level, more accurate insights are gained by adding artificial intelligence for IT operations. The AI/ML models analyse events, metrics, logs, traces, changes and topology, correlated over time to find patterns across the IT environment. This way, anomalies are detected early and sufficient warnings are given to prevent failures. The result is a more efficient, proactive IT operation that enhances customer experience.
Example: Imagine a system that not only provides insights but also takes proactive measures. In this case, it might automatically scale up resources in response to the surge in traffic, preventing any performance degradation before it even occurs. Additionally, it could provide recommendations for optimising the integration for future unexpected traffic spikes.
With this understanding of observability’s depth, we can explore its critical role in managing the complexities of today’s technological landscape.
.
Why invest In achieving observability
In many organisations, monitoring is a traditional method for IT teams to track system availability and performance. However, this reactive approach is often time-consuming. When issues arise, identifying the root cause typically involves coordinating teams, processes, and tools, or manually correlating isolated data fragments. This inefficiency can lead to crucial systems being down for hours, affecting job productivity, customer satisfaction, and the credibility of heavily invested projects, tools, or platforms. Introducing observability as an evolution of monitoring will empower your organisation to mitigate these impacts.
Job productivity – In general, employees strive to perform their job with excellence and to deliver quality. Defining a robust observability strategy bolsters job productivity for several reasons. First, it provides an overview of the IT landscape with real-time information about the different services and alerts about (possible) issues. This results in a quick and easy way to assess the health of the IT landscape. Actionable and useful insights are provided, allowing for proactive measures which enhance the reliability of business-critical IT functions. Second, it provides centralized logging and standardizes implementations, which facilitates root cause analysis and minimizes the time spent on incident investigations. Third, it aids IT development teams in measuring and refining their workflows, contributing to a faster time-to-market.
Customer satisfaction – Customer satisfaction greatly benefits from an effective observability strategy. It enables the early detection of potential issues, allowing for intervention before customers are affected. Monitoring the impact of changes or new features on stability and performance can be followed up closely, and proactive intervention is possible. This ensures the reliability of critical IT services and SLA breaches can be avoided.
Furthermore, it can indirectly provide an organisation with information about customer satisfaction by analyzing usage patterns. For example: frequent purchases or sustained use typically suggest high satisfaction, whereas low purchase rates or quick subscription cancellations may indicate dissatisfaction.
Protect investments – To safeguard investments, insights at the management level are required from business dashboards that provide clear reporting on digital services and their adoption rates. These dashboards contain essential information for ensuring adoption goals are met, positive progress is achieved, and to guide further initiatives or enhancements that support the transition towards a digitally-oriented future. They assist in detecting breaches and assessing impacts from ongoing growth, enabling timely adjustments to maintain compliance with service level agreements. Additionally, dashboards are instrumental in identifying the adoption rate, as well as the general stability and performance of new features.
Now that we have discussed why observability is worth investing in, let’s turn to the practical steps needed to implement it.
How to achieve observability
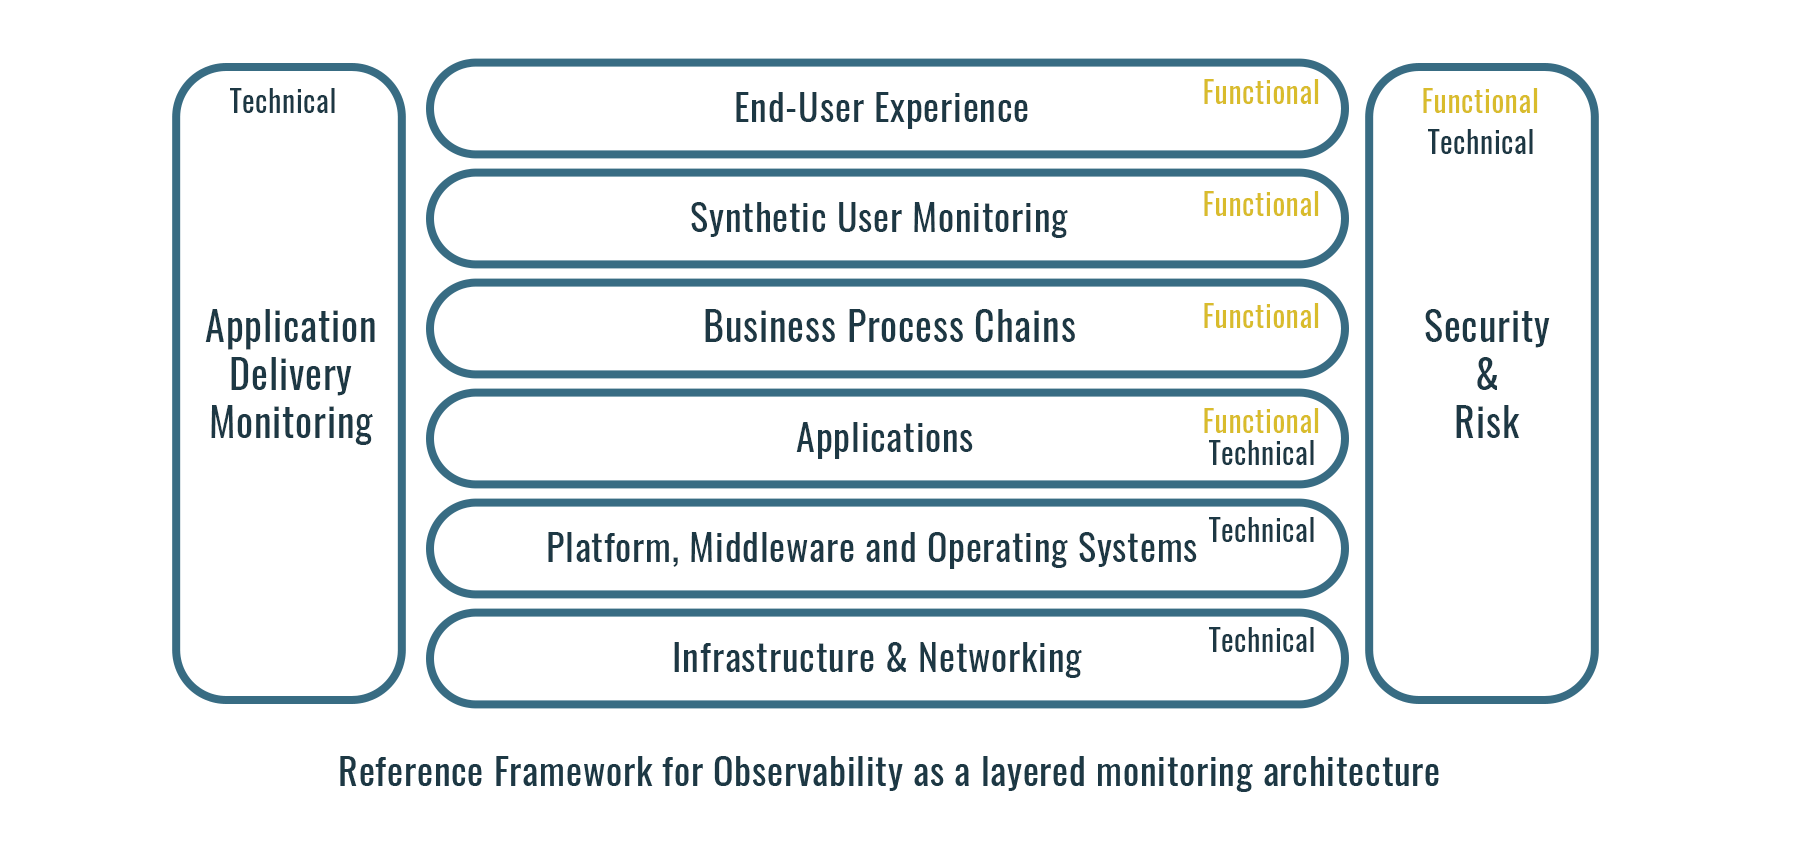
To achieve observability, it’s essential to understand that it serves the needs of all organizational layers involved in delivering critical IT solutions. Various service providers, with clear definitions of the services they provide, cooperate in the observability framework. Each service provider processes its own events and passes through critical events, enabling consumers to conduct their own service monitoring – for instance, the Infrastructure Team as the Infrastructure Service Provider and the Product Teams as Application Service Providers.
Therefore, we position the Reference Framework for Observability and its monitoring capabilities as a layered monitoring architecture

Adopting this observability approach offers many advantages for sharing monitoring information between service providers and service consumers. By passing only the events that directly impact the provided services, service consumers can correlate these critical events to their own services more efficiently. This selective sharing reduces the number of events that consumers need to focus on and minimizes their exposure to technical complexity. Additionally, this layered approach safeguards the privacy of other service consumers, which is especially pertinent for externally hosted services. Moreover, implementing monitoring functionality in this layered approach ensures loose coupling of the various layers. This limits the impact on the overall monitoring system when there are changes in service providers, such as a transition of infrastructure services from internal to external providers or vice versa.
For a layered monitoring architecture to function effectively, every level of the organization should work towards incorporating a degree of observability. Introducing observability in the different layers of an organisation starts with defining the goal maturity level, which must be feasible and aligned with the ambitions of the company’s technological growth and business objectives. Once the goal is clear, the organization must systematically progress through the maturity levels, starting from Level 1 and advancing sequentially to the desired level. It’s essential not to bypass any levels, as growth within a single level is gradual, whereas the growth needed to jump to the next level will be a lot steeper.
The rollout of observability usually starts at the lower levels of the reference framework as these form the basis for the layers on top. For example, applications require insights from the Infrastructure and Networking layer. Therefore, it is crucial for this base layer to establish observability concurrently with or before the Applications layer does. However, it is not necessary for all layers to pursue the same level of observability. For example, Infrastructure might aim for Level 3, and business process chains for Level 2. It is vital though that the foundational layers attain a high enough maturity level to support the information needs of the subsequent layers.
Conclusion:
Observability is a game-changing factor in the field of IT operations, as it goes beyond traditional monitoring, offering profound insights into complex systems. The Observability Maturity Model presents four progressively advanced levels, each building on the preceding one to enhance data capture, analysis, and understanding.
The value of observability lies in its ability to foster a proactive stance on system health and performance, shifting away from reactive measures. This shift leads to a multitude of advantages: it bolsters job productivity, elevates customer satisfaction, and secures investments.
Achieving observability requires a comprehensive approach across all organizational levels. It necessitates the adoption of a layered monitoring architecture for cohesive information sharing. Such a strategy fosters a robust and flexible observability strategy, tailored to an organization’s goals and requirements.
In sum, observability represents a crucial advancement in IT operations. It offers a dynamic framework for organisations to excel within the rapidly evolving technological landscape. By embracing this evolution, organisations stand poised to unlock new levels of efficiency, innovation, and operational excellence.
Looking to implement observability in your organization? Contact us for expert guidance!
Some more integration blogs for you
ALWAYS LOOKING FORWARD TO CONNECTING WITH YOU!
We’ll be happy to get to know you.


